
This post is a recap from a how-to created by Mark MacLeod . I feature some of the most impressive startup strategies we encounter at StartupPlays and share them free, here at Startupnorth.ca. Enjoy.
This guide is available in an interactive how to format Free at StartupPlays.com – Get it here
The number one focus of Mark’s investment and advisory work is SaaS companies. There are lots of reasons to focus on this segment. For one, it’s large ($21B and growing at 20% per year). In addition, it lends itself well to (metrics) and is great for investors because of the visibility and predictability that the best SaaS businesses generate.
The SaaS Terminology Cheat Sheet:
AARRR: A pirate war cry or more importantly, an acronym coined by Dave McClure to summarize the flow of SaaS users from first activation to monetization and referral.
Activation: The first time someone uses your service.
Acquisition: A new user sign up. This does not necessarily mean a paid customer. It means a new user on a free trial or permanently free version. If you don’t have a free trial or free product and the only way for someone to use your product is to pay then acquisition for you is a new paid customer. In this series “user” will refer to people that don’t pay and “customers” will be people that do pay.
ARPU: Average Revenue Per User: Total revenue / # of paying customers.
CAC: Customer Acquisition Cost. Total costs of customer acquisition / # of new customers acquired. This should be calculated both for gross new customers and net new. Net new is net of customers that you lost in the period.
Churn: The % of users / customers that abandon the service over time. This can be measured weekly, monthly, quarterly, etc. You will want to measure churn for users and churn for customers (assuming you have a free trial or freemium product).
- Customer churn: % of paying customers that cancel their subscription.
- User churn: % of free users that stop using the service.
CLTV: Customer Lifetime Value. The expected total revenue from a customer over their lifetime less the cost of generating that revenue less the cost to acquire that customer.
Cohort: Also called cohort analysis or class analysis. A cohort is a group of users that are grouped together based on a common attribute. That could be the month they signed up, the source through which you acquired them, the method in which they use your service (web vs. mobile vs. desktop app), etc. Say, you’re looking at cohorts based on month of sign up. You can then look at usage and monetization patterns for those users over time. For example all users signing up in January are a cohort. You can then look at the % of them that use, subscribe for, churn out, cancel their account etc. in February, March, April, etc.
Conversion: Every time a user moves forward a step in your funnel from visitor (just visiting your web site) to user (signed up) to customer (paying you money) to referrer (helping bring you new users).
- UV conversion: % of new unique visitors that become users.
- Active conversion: % of users that use the service for the 1st time.
- Paid conversion: % of free users that upgrade to a paid account.
Engagement metrics: These are softer metrics that are specific to your application that don’t measure core conversion but measure specific feature uses and overall engagement with your service. Examples include # of likes, session length, # of comments, # of connections, etc.
Freemium: A goto market strategy where you have a permanently free base version of your service. This, hopefully, replaces the need for a big marketing budget and reduces friction for user sign up enabling you to acquire lots of users. From that large user base you convert a small portion to a paid premium version. There are other freemium scenarios such as free content monetized by ads but in SaaS this is the primary meaning for freemium.
K Factor: Also known as “viral co-efficient“. For every active user how many new users do they bring on. If your K factor is > 1 then your user base grows virally or exponentially. This applies well for social games and freemium services that have a built in viral aspect that introduces the game or service to new potential users.
Retention: Subsequent usage of your service. Any usage after the initial (activation use). As you will learn, retention is the most important aspect of a successful SaaS business.
Retention rate: The % of users that continue using the service over time. This can be measured weekly, monthly, quarterly, etc.
Tenure: The # of months or years that you keep a paid customer. Calculated as 1 / churn rate.
Upgrade %: The % of customers that upgrade from you basic plan to a higher plan.
The Business Model
Business model viability, in the majority of startups, will come down to balancing two variables:
- Cost to Acquire Customers (CAC), and,
- Lifetime Value of a Customer (LTV)
Successful web businesses have long understood these metrics as they have such an easy way to measure them. However there is a lot of value in looking at these same metrics for all other businesses, especially in the SaaS model.
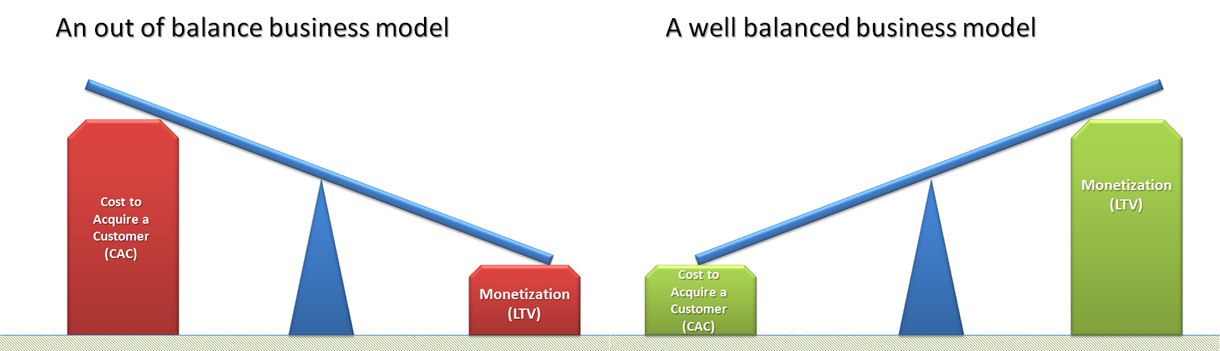
Image source: http://www.forentrepreneurs.com/startup-killer/
Calculating Customer Acquisition Cost – To compute the cost to acquire a customer (CAC) you would take your entire cost of sales and marketing over a given period, including salaries and other headcount related expenses, and divide it by the number of customers that you acquired in that period. Use the “Cost To Acquire” sheet of the workbook to help calculate this.
Calculating Lifetime Value – To compute the Lifetime Value of a Customer, LTV, you would look at the Gross Margin that you would expect to make from that customer over the lifetime of your relationship. Gross Margin should take into consideration any support, installation, and servicing costs. Use the “Lifetime Value” sheet of the workbook to help calculate this. SaaS businesses are usually initially very high cash intensive businesses because you pay upfront to acquire a customer and the customer only becomes profitable over time. So, you have a gap in cash flow. You can grow organically by saving up enough margins from your existing customers to acquire more, but this is slow. If you want to dominate your market, you need outside capital to maximize the pace of growth (more on this later). At the seed and series A stages, I recommend startups spend no more than 6 months of revenue to acquire a customer. This is because i.) cash tends to be tight; and ii.) the startup does not have enough cohort data to know for sure how many months customers stay on average. Later, when you have more data and more cash you can be more aggressive and spend more. It’s important to do this calculation both for your overall customer base and by price plan. You will likely find your higher price customers stick around a lot longer. 
Tipping the Balance – Tactics for Optimizing your Model
If you are building a data driven company then i.) your entire team should have daily access to key stats (just put up Geckoboard on a big monitor and connect everything to it); and ii.) each team member should own a metric.
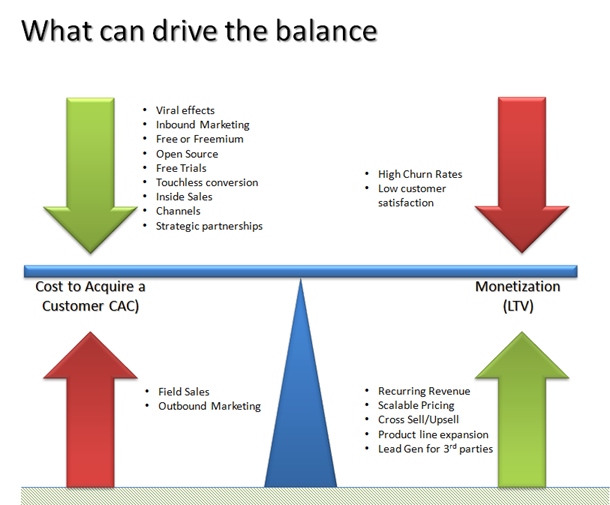
Brainstorm – with your team – 5 ideas/strategies around the two key elements (Monetization and CAC) with help from the examples given. Calculate Your Monthly Recurring Revenue (MRR) And Average Revenue Per User (ARPU) – Monthly Recurring Revenue (MRR) is calculated by multiplying the total number of paying customers by the Average Revenue Per User (ARPU). This is usually a key indicator of profitability. Use the “Monthly Reoccurring Revenue” sheet of the workbook to help calculate this. 
Look at your CAC ratio monthly: this is the new Monthly Recurring Revenue (MRR) you added in the month * gross margin / the customer acquisition costs incurred that month. You can read more about this important ratio here.
This and more is available in a step-by-step interactive format at StartupPlays.com
![]()
